CALIFORNIA STATE UNIVERSITY, NORTHRIDGE
Instructional Grouping: An Interactive Dashboard for Classroom Teachers
A graduate project submitted in partial fulfillment of the requirements
For the degree of Master of Arts
By
Joseph Nemchik
December 2025
Copyright by Joseph Nemchik 2025
The graduate project of Joseph Nemchik is approved:
_________________________________________ ______________
Shyra J Minton, Ed.D. Date
_________________________________________ ______________
Donald D Tatukus Date
_________________________________________ ______________
Pete G Goldschmidt, Ph.D., Chair Date
ACKNOWLEDGEMENTS
This project is completed through the unwavering support of Dr. Pete G Goldschmidt and Dr. Shyrea J Minton. The concept was first conceived in 2014 when master teacher Dave Tatukus suggested the potential choice of breaking a class of 45 students into collaborative, differentiated groups.
I would like to thank the Faculty of California State University Northridge for their inspiration.
This work is a melding of the technological and logical with the intrapersonal and personal. With that, I acknowledge the support of my parents, of which I am a combination. My father, Dr. Joseph Nemchik PhD, a career electrical engineer and my mother, Carol, a social worker and instructional designer.
DEDICATION
This project is dedicated to the diverse students of Los Angeles, California and the many classroom teachers who work tirelessly to meet their unique needs.
TABLE OF CONTENTS
SIGNATURE PAGE ...................................................................................................................... ii
COPYRIGHT PAGE .................................................................................................................... iii
ACKNOWLEDGEMENTS .......................................................................................................... iv
DEDICATION ............................................................................................................................... v
TABLE OF CONTENTS .............................................................................................................. vi
LIST OF GRAPHICS ................................................................................................................ viii
ABSTRACT ................................................................................................................................. ix
CHAPTER ONE: INTRODUCTION ............................................................................................ 1
Scope of the Problem ......................................................................................................... 1
Teachers Needs and Barriers .............................................................................................. 1
Purpose of the Project ........................................................................................................ 1
Key Terms ......................................................................................................................... 2
CHAPTER TWO: LITERATURE REVIEW ............................................................................... 3
Small Group Instruction .................................................................................................... 3
Grouping Interventions ..................................................................................................... 3
Types of Grouping ............................................................................................................ 5
Average Differences .......................................................................................................... 6
Moderators ........................................................................................................................ 6
Readiness as a Moderator ................................................................................................ 7
Initial Performance as a Moderator for Post Lesson Performance ................................. 7
English Language Level as a Moderator .......................................................................... 9
Grouping students based on Personality Traits ................................................................ 11
An Algorithm for Group Forming ................................................................................... 12
Preferences for Teacher-Selected vs. Student-Selected Groupings ................................. 14
Teacher Preference for Grouping Students ...................................................................... 15
CHAPTER THREE: FUNCTIONALITY AND RATIONAL .................................................... 17
Rational Behind Each Feature of the Dashboard ............................................................. 17
Data Entry ........................................................................................................................ 17
First Name, Last Name ........................................................................................ 17
Pretest Score ........................................................................................................ 18
ELD Level ........................................................................................................... 18
Table Size ............................................................................................................ 18
Sort Options ..................................................................................................................... 18
Heterogeneous Sort .............................................................................................. 18
Homogeneous Sort ............................................................................................... 19
English Learner Sort ............................................................................................ 19
First Name Sort .................................................................................................... 19
Random Sort ........................................................................................................ 20
Comnclusion ........................................................................................................ 20
CHAPTER FOUR THE DASHBOARD: ................................................................................... 21
CHAPTER FIVE: DISCUSSION AND CONCLUSION ........................................................... 24
Limitations ...................................................................................................................... 22
Future Research ............................................................................................................... 25
Additional Features .......................................................................................................... 26
Implementation Considerations ....................................................................................... 26
Policy Implications .......................................................................................................... 27
Recommendations for School Districts ........................................................................... 27
Recommendations for Individual School Sites ............................................................... 28
Recommendations for Individual Teachers ..................................................................... 28
REFRENCES .............................................................................................................................. 21
LIST OF GRAPHICS
Dashboard Screenshots ....................................................................................................... 15
Abstract
Instructional Grouping
By
Joseph Nemchik
Master of Arts
This project creates an online dashboard for classroom teachers that sorts student rosters into instructional groups, http://www.classroomgrouping.com. This dashboard adapts to class size and classroom layout constraints, streamlining the process of sorting students into groups. The dashboard allows teachers to choose from multiple sorting types. The sorting types used were chosen based on recommendations from researchers and the teachers and students they studied. Multiple sort options are included because it is expected that there is no one optimal way to sort students into groups. (Liu, 2005; VanTassel-Baska et al., 2020) Relative student strengths and weaknesses and workgroup dynamics may factor into how teachers use this dashboard.
CHAPTER ONE: INTRODUCTION
At present, a majority of classroom teachers lack the “consistent use of flexible grouping practices to support instructional goals” (VanTassel-Baska et al., 2020) Research suggests teachers should consider assigning students to workgroups based on student needs, abilities and preferences. Research also suggests that, when choosing group makeup, teachers should also consider the specific instructional task. (VanTassel-Baska et al., 2020)
Teacher Needs and Barriers
Many teachers believe that the intentional instructional grouping of students can be an effective way to deal with the challenges of their diverse classrooms. They are aware of a number of strategies for working with intentionally-selected groupings, including same-ability groups and peer tutoring (Park and Oliver, 2009). However, many are still using whole-class instruction almost exclusively. They cite lack of planning time, possible negative effects and lack of administrative support as reasons they might avoid implementing in-class instructional grouping (Schumm et al., 2000).
Purpose
This project accomplishes two main goals. 1. Allow teachers to put students into groups in a minimal amount of time. In the hands of a busy teacher, this could mean being able to choose small-group instruction rather than just defaulting to a whole-class lecture. 2. Provide teachers with usable sort algorithms that may minimize or eliminate research-identified negative effects of grouping. The lists generated by this project may be used as-is, or, time-permitting, may be used as a strong starting point for an experienced teacher who chooses to tweak the lists based on unique student differences.
Chapter Two reviews the literature on instructional grouping, including how group makeup may affect learning and motivation among students. It also reviews teacher and student preferences, attitudes and behaviors regarding grouping. Chapter Three explains the functionality of the grouping dashboard. This includes an explanation of what each feature does as well as a rationale for why each feature was chosen. A usable beta version of the dashboard is available through a link under the Chapter Four heading, along with screen shots and explanations. Chapter Five makes suggestions about implementing the dashboard. It recommends additional research that could potentially lead to improvements of the dashboard.
Key Terms
Instructional grouping the practice of dividing a class into smaller groups of students for a period of time in order to better meet the diverse needs of students
Same-ability groups Students with similar abilities are grouped together for instruction (Moody et al., 1997)(used interchangeably with Homogenous groups)
Mixed-ability groups Students of differing abilities are grouped together for instruction (Moody et al., 1997)(used interchangeably with Heterogeneous groups)This is different than a randomized group.
Inter-group variance the difference between members within a group (Liu, 2005) In the context of this project the “difference” refers to a variable value, such as the difference in pre test scores.
Cooperative groups Students work together in small groups to help one another learn academic material, groups are usually mixed ability (Moody et al., 1997, p. 348)
Flexible grouping Students are placed in temporary groups (either mixed or same ability) based on various criteria, including student interest, enrichment, behavior, or common skill development needs (Moody et al., 1997, p. 348)
CHAPTER TWO: LITERATURE REVIEW
This chapter is a review of the literature concerning intentional, within-classroom instructional grouping. Specifically it addresses current practices and preferences of teachers and students. Ways that intentional grouping may improve or worsen the learning conditions within a diverse classroom of students will be addressed. How different types of grouping might differ depending on instructional tasks or types of learners will also be reviewed. Finally teacher beliefs, behaviors and areas of teachers' need for support will be identified.
Small Group Instruction
Small group instruction refers specifically to the practice of taking a classroom full of students, dividing them into groups and having each group work independently. This may include students in each group collaborating with each other. This may be highly structured, where each student is given a unique task within the group, for example, recorder, experimenter, reporter. It may also be less structured, where students are asked to freely contribute. Grouping may involve teachers dividing their time and attention between each group, focusing on each group for a set amount of time or as needed. It may also involve differentiated instructions or materials, that is, each group in a single classroom may have a different learning task, procedure or assignment.
There is an extensive amount of literature on the possible benefits of this type of instruction. Many studies show the effects of specific interventions that implement small group instruction with some type of targeted instruction.
Grouping Interventions
In a study of (n = 522) pre-kindergarten students and (n = 652) kindergarten students, Mesa et al. (2025) implemented targeted small group interventions to a total of (n = 345) small groups. After the intervention, students showed improvement. A slight improvement was seen in syntax and vocabulary, defined as less than one standard deviation of improvement. Students improved on average three raw points in narrative language skills. The authors state, “peer language skills are related to the development of students’ language skills in the context of targeted, small-group instruction. However, these relations appear to be complex and vary depending on the language skill, conceptualization of peer language skills, grade level, and pretest score (Mesa et al., 2025, p. 205).”
Bonesrønning, et al. (2022) studied groups of students for one, two and three years. Students were given an intervention of 30 hours of small group instruction per year. The intervention was planned and implemented by qualified teachers but also included a tutor to work with the small groups. They found an effect of 0.06 standard deviation improvement on the national test (Norway). The authors consider this high given that they deem this intervention a “low dosage” treatment, but note that this effect was shown without the need to drastically increase resources.
Using a quasi-experimental design as part of a larger experience, Kamps et al. (2008) studied a small group reading intervention. The larger study was an experiment on a three-tier system, this is selecting students for various tiers of intervention based on indicated needs. Kamps et al. (2008) looks specifically at participants who were assigned to small groups of three to six students to receive specific, targeted reading instruction. The students received the instructional curricula Reading Mastery (1995), Early Interventions in Reading (Mathes & Torgesen, 2005) and Read Well (Sprick et al., 1998). Students showed improvement from small group instructions. Furthermore, they showed varying levels of improvement depending on the curriculum the were taught. This suggest that small groups are most beneficial when an effective curriculum is implemented, and also that small group instruction may allow students to be assigned to a curriculum that may be optimal for their specific needs, compared with the average needs of a whole class.
Dahl-Leonard et al. (2024) performed an observational study focusing on small-group reading instruction targeted at at-risk students. Lessons were video recorded and coded. Teachers were interviewed. Teachers reported delivering small-group instruction for 10 to 30 minutes with an average time of 20 minutes. Within small groups, teacher used visual aids, flashcards, manipulative and sound boxes. Researchers found teachers “often relied on reading approaches in which students read texts at a pre-specified instructional reading level (usually based on the results of a running-record assessment) while the teacher scaffolds students’ reading and guides a discussion of the text (Fountas & Pinnell, 2012). We also found that kindergarten teachers’ small-group reading instruction often reflected research-based recommendations regarding instruction for students at risk. (Dahl-Leonard et al., 2024, p.559)”
Types of Grouping
There are two main types of instruction grouping throughout the literature, homogeneous or same-ability grouping, where students with similar characteristics are grouping together and heterogeneous or mixed-ability grouping, where students with differing characteristics are grouped together. Potential mathematical definitions for this type of instructional grouping are discussed later in this chapter.
Researchers have compared heterogenous groups with homogenous groups determined through various characteristics, including unit pretest scores (Kieffer et al., 2025; Saleh et al., 2005), local standards test scores (Tieso, 2005) and personality type (Schullery and Schullery, 2006).
Depending on the study, researchers have measured a number of different outcomes including posttest reading and literacy scores (Kieffer et al., 2025; Saleh et al., 2005; Tieso, 2005), attitudes toward grouping and affect (Mitchell et al., 2004) and motivational beliefs (Saleh et al., 2005). Results are often moderated by one or more factors including the initial grouping criteria as well as English language proficiency (Kieffer et al., 2025).
Additionally, Mitchell et al. (2004) studied the effects of teachers allowing students to choose their own groups.
Average Differences
Some studies suggest no significant difference between the average heterogeneous groups and an average homogeneous group. This is especially the case when no differentiation is specified, that is, when students were grouped but given identical instruction and learning tasks.
Kieffer et al. (2025) studied 84 English Learners in 14 fourth and fifth grade classrooms. Students were randomly assigned to be grouped either heterogenously (mixed with other non English Learners) or homogeneously, grouped only with other English Learners. After instruction, they found no average difference in test scores between the English Learners who were grouped heterogenously and those who were grouped homogenously.
Saleh et al. (2005) studied 104 fourth graders. Students were randomly assigned to heterogeneous or homogenous workgroups based on science pretest ability scores. Similar to Kieffer et al. (2025) They found no average difference post instruction.
Moderators
Studies consistently suggest grouping strategies may not affect all groups equally.
This can be seen when researchers look at moderating variables. That is to say the effects of grouping strategies change depending on student characteristics. In this case, moderating variables are student characteristics, such as giftedness or English Language proficiency scores. Some subsets of students may benefit more from homogenous grouping, while others may benefit more from heterogenous grouping.
Readiness as a Moderator
In a study focused on grouping for gifted students, Carol Tieso (2005) found differentiated instruction, combined with grouping gifted students together within a class may provide the most substantial benefit to the gifted students. The study looked at 31 fourth and fifth grade teachers and their 645 students. Students were grouped in a variety of ways, including whole class, between class (where students are placed in different classrooms) and within class (where groups are formed within a common classroom). There was also a control group. There were within-class groups where students were put into homogenous groups within their classroom based on readiness pretest scores. Whole-class and between-class groupings were also studied. Students were given a three-week unit of instruction followed by a posttest on the mathematics curriculum that was being used. Among within-class groups, the study showed the largest effect size on the students who scored highest on the pretest, ES = .83 SD. This study did not show a statistically significant increase or decrease in performance among the “low” groups of students in the study.
Initial Performance as a Moderator for Post Lesson Performance and Overall Motivation
Homogeneous grouping is often touted as essential for meeting the needs of gifted or high achieving students (Park and Oliver, 2009). While Tieso (2005) did not show negative effects on low students, other studies suggest a lack of benefit, with possible detrimental effects on some aspects of learning within the low student groups (Kieffer et al., 2025; Saleh et al., 2005).
While Kieffer et al. (2025) found no average difference in the scores from post-lesson language and comprehension measures, they found students with higher initial English proficiency (one standard deviation from the mean) performed better on three post-lesson language and comprehension measures when grouped heterogeneously (Hedge’s g = 0.59 and g = 0.34 and g = 0.27). Conversely, they found students with lower initial English proficiency (one standard deviation below the mean) performed worse on three post-lesson language and comprehension measures when grouped heterogeneously (g = -0.31 and g = -0.58 and g = -0.47)[1].
Saleh, et al. (2005) studied how grouping arrangements affect students' achievement, social interaction, and motivation. The study consisted of boys ages 9 and 10. A randomly-assigned half of the participants (52) were put into 13 heterogeneous within-class groups. The other half of the participants were put into 13 homogeneous within-class groups. Over a nine-week period, students received 16 plant biology lessons from a fourth grade textbook. All lessons began with a brief whole-class introduction which transitioned into a series of small-group collaborative learning tasks. Each collaborative work group was video taped three times for approximately ten minutes each over the course of the study to assess for social interaction. To determine group composition, students were categorized as high ability (upper 25%), average ability (middle 50%) or low ability (bottom 25%) using the Science Elementary Achievement Test (SEAT). The "How I feel about working in groups at school" questionnaire (McManus & Gettinger, 1996) was used to assess student motivation. Identical ten-item pretests and posttests were used to determine students’ academic progress.
Saleh, et al. (2005) found the effect of group composition was moderated by student ability scores. While there was no significant difference between heterogeneous groups and high ability groups, there was a significant increase in the performance of average ability groups and a significant decrease in low ability groups. Occurrences of Individual elaboration and collaborative reasoning interaction increased in the heterogeneous groups compared with all homogeneous groups.
Students were given the "How I feel about working in groups at school" questionnaire (McManus and Gettinger, 1996) pre and post instruction. This questionnaire includes questions relating to academic benefits, social benefits and attitude benefits. Motivational beliefs about collaborative learning, tested before and after instruction, decreased significantly in low ability students who were grouped homogeneously compared with heterogeneously-grouped low ability students. The differences in motivation for high and average students did not reach statistical significance.
English Language Level as a Moderator
In an effort to understand the effects of different types of in-class grouping on language development in English Language learners, Kieffer et al. (2025) ran a randomized controlled trial. They compared the differences between homogeneous grouping and heterogeneous grouping.
The study included n = 84 English language learners in fourth and fifth grade classrooms between five schools in the northeastern United States. The home languages of these students included Chinese and Spanish among others. Researchers purposefully chose schools with large numbers of English learners. Thirteen classroom teachers participated in the study. Twenty eight non-English learners participated, but they were not the focus of the study.
Students in the study were randomly assigned to either heterogeneous groups (two ELs and two no ELs) or homogeneous groups (four ELs). Teachers used the six cycles of the CLAVES curriculum.
Before instruction, students’ reading comprehension, vocabulary, morphology and word recognition/decoding was tested with the ReadBasix assessment program, an Educational Testing Service development. After instruction, their reading comprehension was tested again. They also took the CLAVES language skills test.
The study found no significant difference between the average heterogeneous group and an average homogeneous group. They did find statistically significant interactions between prior English skills and grouping. Reading comprehension (p = .038), CLAVES language skills (p = .015), and CALS-I (p = .023) may all moderate the effects of grouping choice. Students at more emergent levels of English proficiency may benefit more from homogeneous grouping, while English learners at more advanced English levels may benefit more from heterogeneous grouping.
Dussling (2020) performed a multiple-baseline-across-groups study (no control group) on a targeted reading intervention for English Learners. The 13 fifth grade students (seven English Language learners and six native English-speakers) were placed into small heterogeneous groups (approximately half EL, half native) of four to five students. All groups received targeted instruction on spelling and phoneme awareness skills. Posttest analysis showed a statistically significant, medium effect on spelling skills (p =.021, r =.43). All students in the study, both ELLs and native English-speakers, showed an increase in scores
While this study was not designed to examine the effects of specific types of group makeup, it does suggest that intervention can be beneficial to scores in the context of heterogeneous small groups of English learners and Native English speakers.
Grouping students based on Personality Traits
Shullery and Shullery (2006) studied 394 business and communications students. Students were given a short form analog of the Meyers-Briggs Personality Inventory (MBTI). They were put into groups which had an average size of 3.8. They worked for 5-7 weeks on a collaborative class-related (business) project. Authors derived eight variables used to define the homogeneity or heterogeneity of the personality traits within groups. The researchers compared project learning outcomes with the relative homogeneity or heterogeneity of the personalities within each group.
The authors conclude that there is a lot of give-and-take when grouping this way. Therefore educators may be hard-pressed to find one grouping strategy that benefits all learners and all aspects of the learning process. However, they do conclude that their results suggest placing shy male students in groups that are high in average MBTI heterogeneity. Conversely, they suggest placing shy women in groups that are high in total MBTI homogeneity.
In contrast with this work, in a smaller study (N = 64), Amato and Amato (2005) found no significant difference in skills development between heterogeneous and homogeneous MBTI groups. Unlike Shullery and Shullery (2006) Amato and Amato (2005) used a certified Meyers-Briggs administration. Student projects were on the topics of macroeconomics and marketing strategy.
Amato and Amato (2005) conclude with the recommendation that teaching students about themselves and the dynamics involved with working with different types may improve overall satisfaction with the process of working in groups (p. 50).
An Algorithm for Group Forming
Eric Zhi-Feng Liu (2005) published a recommendation that researchers consider using a universally agreed upon algorithm for determining baseline heterogeneous work groups. Specifically, he suggested forming groups where the sum of the variance between individuals in each group is maximized. This refers to the variance in whatever variable is used to select groups. For example if students were sorted by pretest score, an ideal heterogenous group would maximize the sum of all differences in pretest scores between students within groups. He is clear this is not likely to be a perfect group due to individual strengths and weaknesses and their interactions with group dynamics.
This is in contrast to other studies that are reviewed, which use simpler methods. Saleh et al. (2005) for example, breaks down scores into three groups before for sorting, top 25%, middle 50% and bottom 25%.
Liu (2005) recommends using a simulated annealing algorithm for accuracy and uniformity. Simulated annealing algorithms are not typically used in educational research. The term gets its name "annealing" from metallurgy and material sciences, as this type of mathematical algorithm is used to predict the behavior of heat-treated materials. In the case of group formation, this type of algorithm would be one way to estimate the optimized within group variance described above.
Preferences for Teacher-Selected vs. Student-Selected Groupings
In order to better understand the motivational and psychological consequences of students choosing their own groups compared with teachers selecting student groups Mitchel et al. (2003) administered questionnaires to different groups of high school students who were grouped in various ways. The researchers predicted that students who chose their own groups might develop a more negative attitude towards choice in the future. They also predicted that students would feel pressure to choose their friends, regardless of whether or not they would be the most productive choice.
This study (Mitchel et al. 2003) included 139 students grades 10 and 11 (54 females and 85 male). The study used three discrete methodologies, teacher as researcher, pretest/posttest and focus group. Students were surveyed about their attitudes toward group work and collaboration and group selection. The sample was then randomized into two groups. One group was allowed to choose their own lab work groups, the other had their lab workgroups chosen by the teacher. After a six-week duration in which students went through three instructional units and rotated through all roles within their lab group, the students were surveyed again. Finally students participated in a focus group regarding their experiences.
The Classroom Life Scale (CLS; Johnson and Johnson, 191) short form was used to measure attitudes on grouping. Also used were two additional questionnaires which asked specific questions including “I prefer to choose the students I work with" or "I prefer the teacher choose the students I work with (Mitchell et al., 2004 p. 23).”
Researchers found no significant difference in the attitudes of students who chose their own groups compared to students who were placed into groups. Of note, students in the study were conflicted about choosing their own groups. While they appreciated the independence, they were not confident in their own ability or their teacher’s ability to choose optimal groups. In some situations they felt good friends or intelligent students might not necessarily be hard workers or assets in a group setting. They also felt teachers might not always know students as well as their peers. This suggests teachers should not be timid in their choice to group students. Though students may occasionally want to work with their friends, they ultimately understand the need to be grouped rationally (Mitchel et al. 2003).
Teacher Preference for Grouping Students
Park and Oliver (2009) noted that teachers encounter a range of issues when working with gifted students in their classrooms, including “asking challenging questions, (b) being impatient with the pace of others/getting easily bored, (c) having perfectionist traits/having a fear of failure, (d) disliking routine, drills, and busy work, (e) being critical of others, and (f) being aware of being different from others” to deal with these challenges in general education classrooms, teachers implement both peer tutoring as well as homogeneous grouping. Teachers believe peer tutoring may help gifted students develop social skills in dealing with their peers; while teachers believe homogenous grouping of gifted students may provide emotional support.
Schumm et al., (2000) studied thirty-nine third grade teachers and found a majority of them used whole class instruction. The study found several teacher-perceived barriers to grouping. One of the barriers was the amount of planning time required to offer small-group instruction (p. 481). Another was the effect on student emotions. Teachers did not want lower performing students to feel like they were always put in a low group. Third, teachers in the study perceived that their school administration was in favor of whole-class instruction. (p. 482)
Teachers in the study (Schumm et al. 2000) described a process of pulling students in need of extra help into a separate group, on the fly, but in 120 hours of observation, the researchers only observed this once. Again, teachers stated that time was a big factor preventing them from doing this more often. (p. 482).
Od-Cohen and Hadari (2015) conducted semi-structured interviews on the attitudes and practices of first-year elementary English and Physical Education teachers regarding small group instruction. They found teachers saw benefit in small group instruction to the point that they were “willing to invest hours of their personal time and without remuneration.”(p. 533) They also found, “In summary, it can be stated that novice teachers have no structured program for small group instruction.” (p. 533) One teacher in the study noted a lack of paid hours to plan small group instruction as a difficulty. Most teachers in the study described a lack of time and or resources to assist with small group instruction. (p. 555)
While the study does not offer quantitative data on the types of grouping used. It does suggest some teachers took a homogeneous approach. One teacher described, "in language lessons as well I take out students who have difficulty in acquiring reading / writing." (p. 552) Another stated “Every group has a different problem. In one group, I work on reading texts and reading rules as all words ending in 'ght' or any words that end in 'all' which, unfortunately, they have not learned. In another group I work on sentence structure.” (p. 552) There was no mention of heterogeneous groups in this study. This may suggest that either the researchers or the subjects did not see it as a relevant option within the category of “Small Group Instruction”
In contrast to studying the decisions and preferences of first-year teachers, Ardasheva et al. (2019) interviewed experienced upper elementary teachers. They found, “depending on the subject area and task, the teachers navigated among multiple SGI set-ups, including similar-ability groups, mixed-ability groups, performance- or current-needs-based groups. (Ardasheva et al., 2019, p. 97)” They found teachers uniformly showing a preference for homogeneous groups for literacy activities. They noted teachers tended to form groups “on the spot (Ardasheva et al., 2019, p. 97)” for mathematics tasks.
CHAPTER THREE: FUNCTIONALITY AND RATIONAL
This dashboard was created with PHP, HTML and MySQL. It should be able to run without issue on most hosts with these features. While districts and individual schools may choose to add student data, the individual classroom teacher is the intended end user. In its current incarnation, the dashboard includes five sort method pages and one data entry page. Each sort page has the additional feature of “Table Size” which refers to the number of chairs that fit around physical tables in the classroom in which the dashboard is being used. The following section presents the key elements of the app, their purpose and how they work.
Data Entry
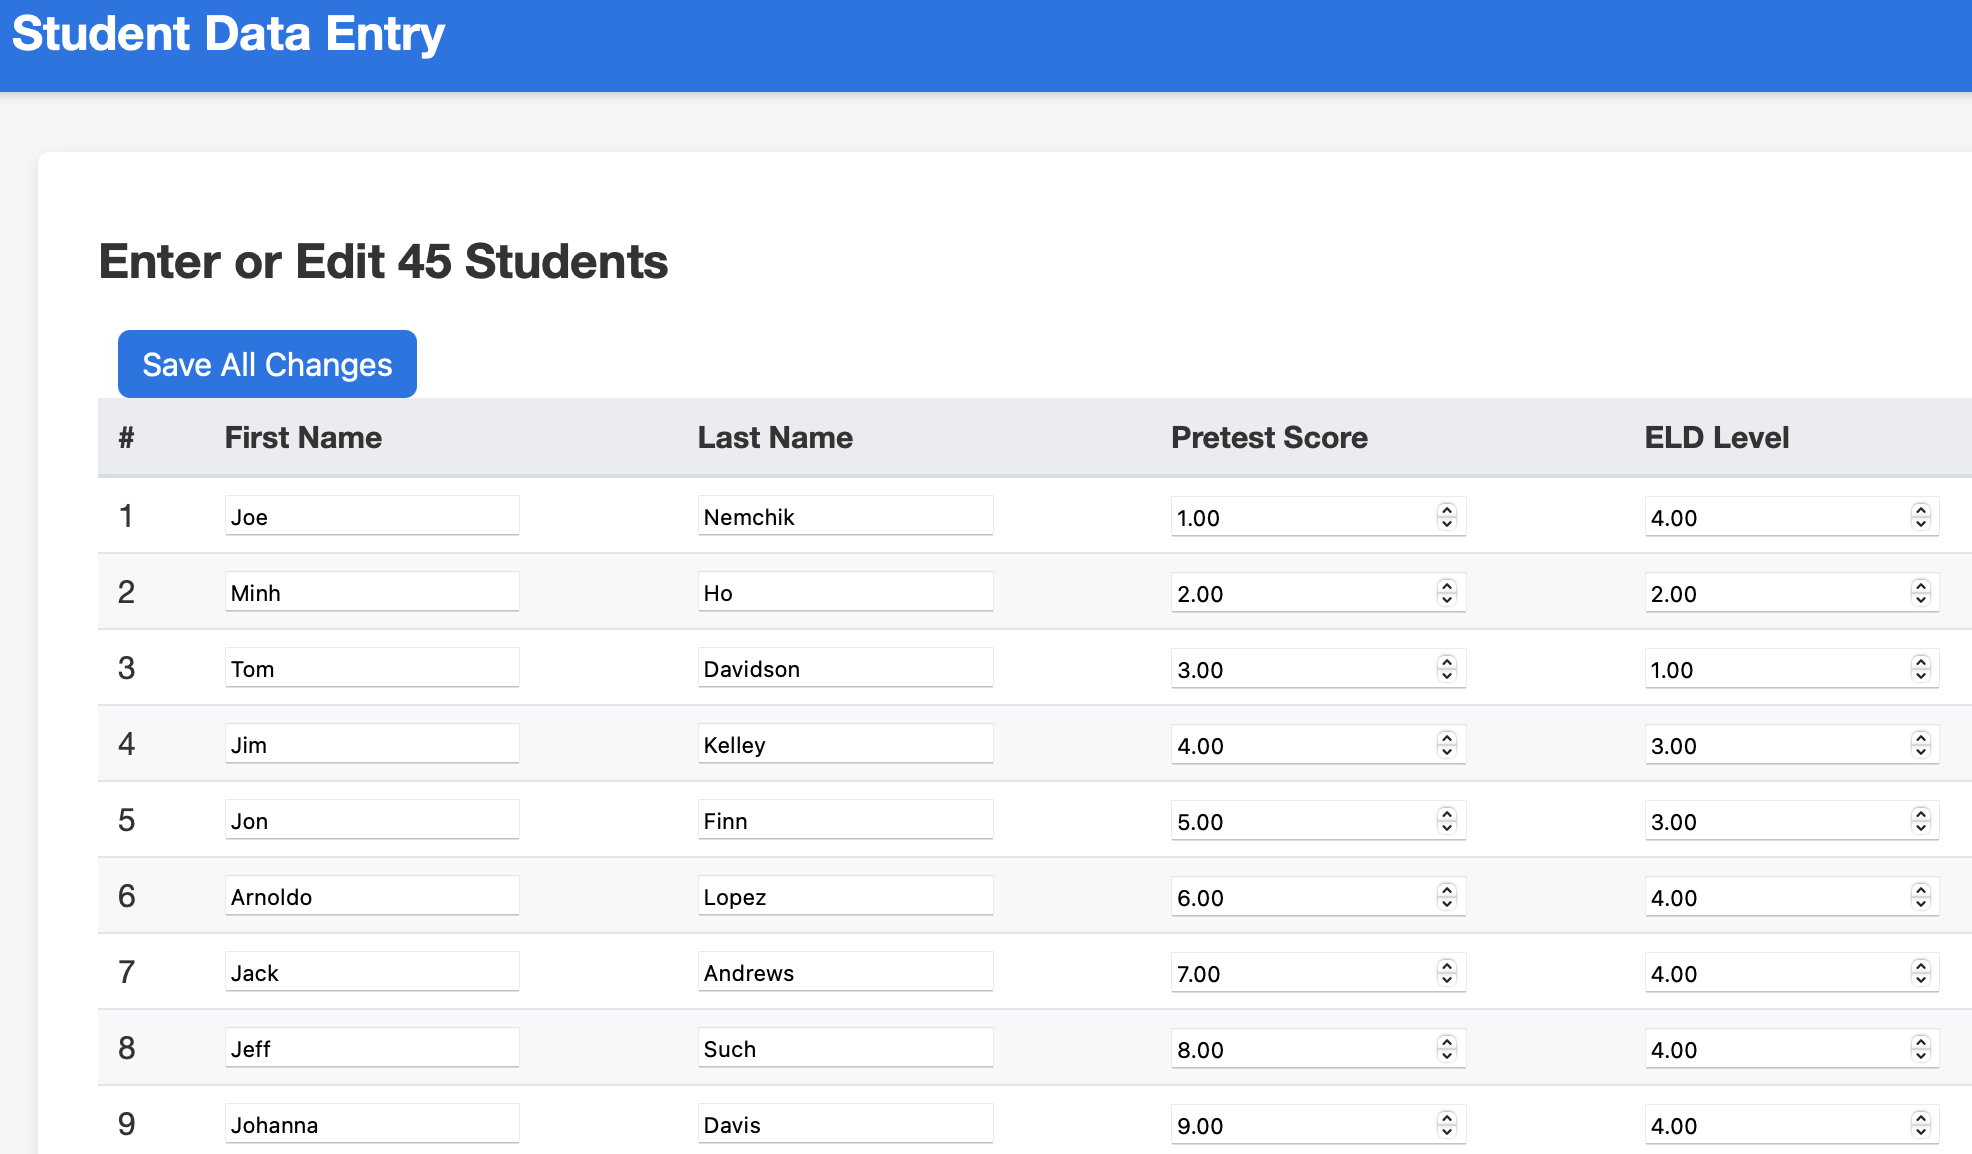
The page included in the prototype of this project is a way for an individual, a teacher, a committee member or an administrator to manually populate the database with student data. In a large-scale implantation, student data might be input in bulk via connection with a learning management system or the input of student rosters or CSV files. At present, the database includes four fields. Additional fields may be added in future iterations based on teacher and district needs, for example, sorting based on state testing or data from a unique student project or assignment. The included fields were chosen as a way to implement the suggestions of research, including grouping by language pretest scores (Saleh et al., 2005), grouping by language ability (Kieffer et al., 2025) and grouping to maximize variance (Liu, 2005).
First Name, Last Name
Here the user types the fist name and last name of a student into the respective text boxes. These fields are set to varchar(100). They will accept capital and lower-case letters and names up to 100 characters in length, if needed. They will also accept other alpha-numeric ways of identifying students such as student ID numbers, nicknames and birthdays.
Pretest Score
This field is set decimal(5,2). It will accept numbers from 0.01 to 99999.99. It is included based on research that suggests heterogeneous grouping based on pretest scores may increase posttest scores when compared with homogeneous grouping (Saleh et al., 2005). Depending on the situation, other numerical data could easily be used in this field, for example, standardized test scores, scores from previous units, numbers that represent student personality, etc. As new research or evidence becomes available, users may choose to include many other types of numerical data in this field.
ELD Score
This field is set decimal(5,2). It will accept numbers from 0.01 to 99999.99. Although many numbers could be used depending on data and location, the demonstration uses numbers 1,2,3 and 4, 1-3 representing the three California ELD levels, Emerging, Expanding, and Bridging (California Department of Education, 2012), and 4 representing a non-EL student.
Table Size
This feature appears on all five of the dashboards sort options. It sets the maximum group size, generally determined by the classroom seating arrangements. It allows for groups as large as six and as small as two. Note, the dashboard purposefully avoids groups of one. Some group sizes may be of differing sizes to accommodate this rule.
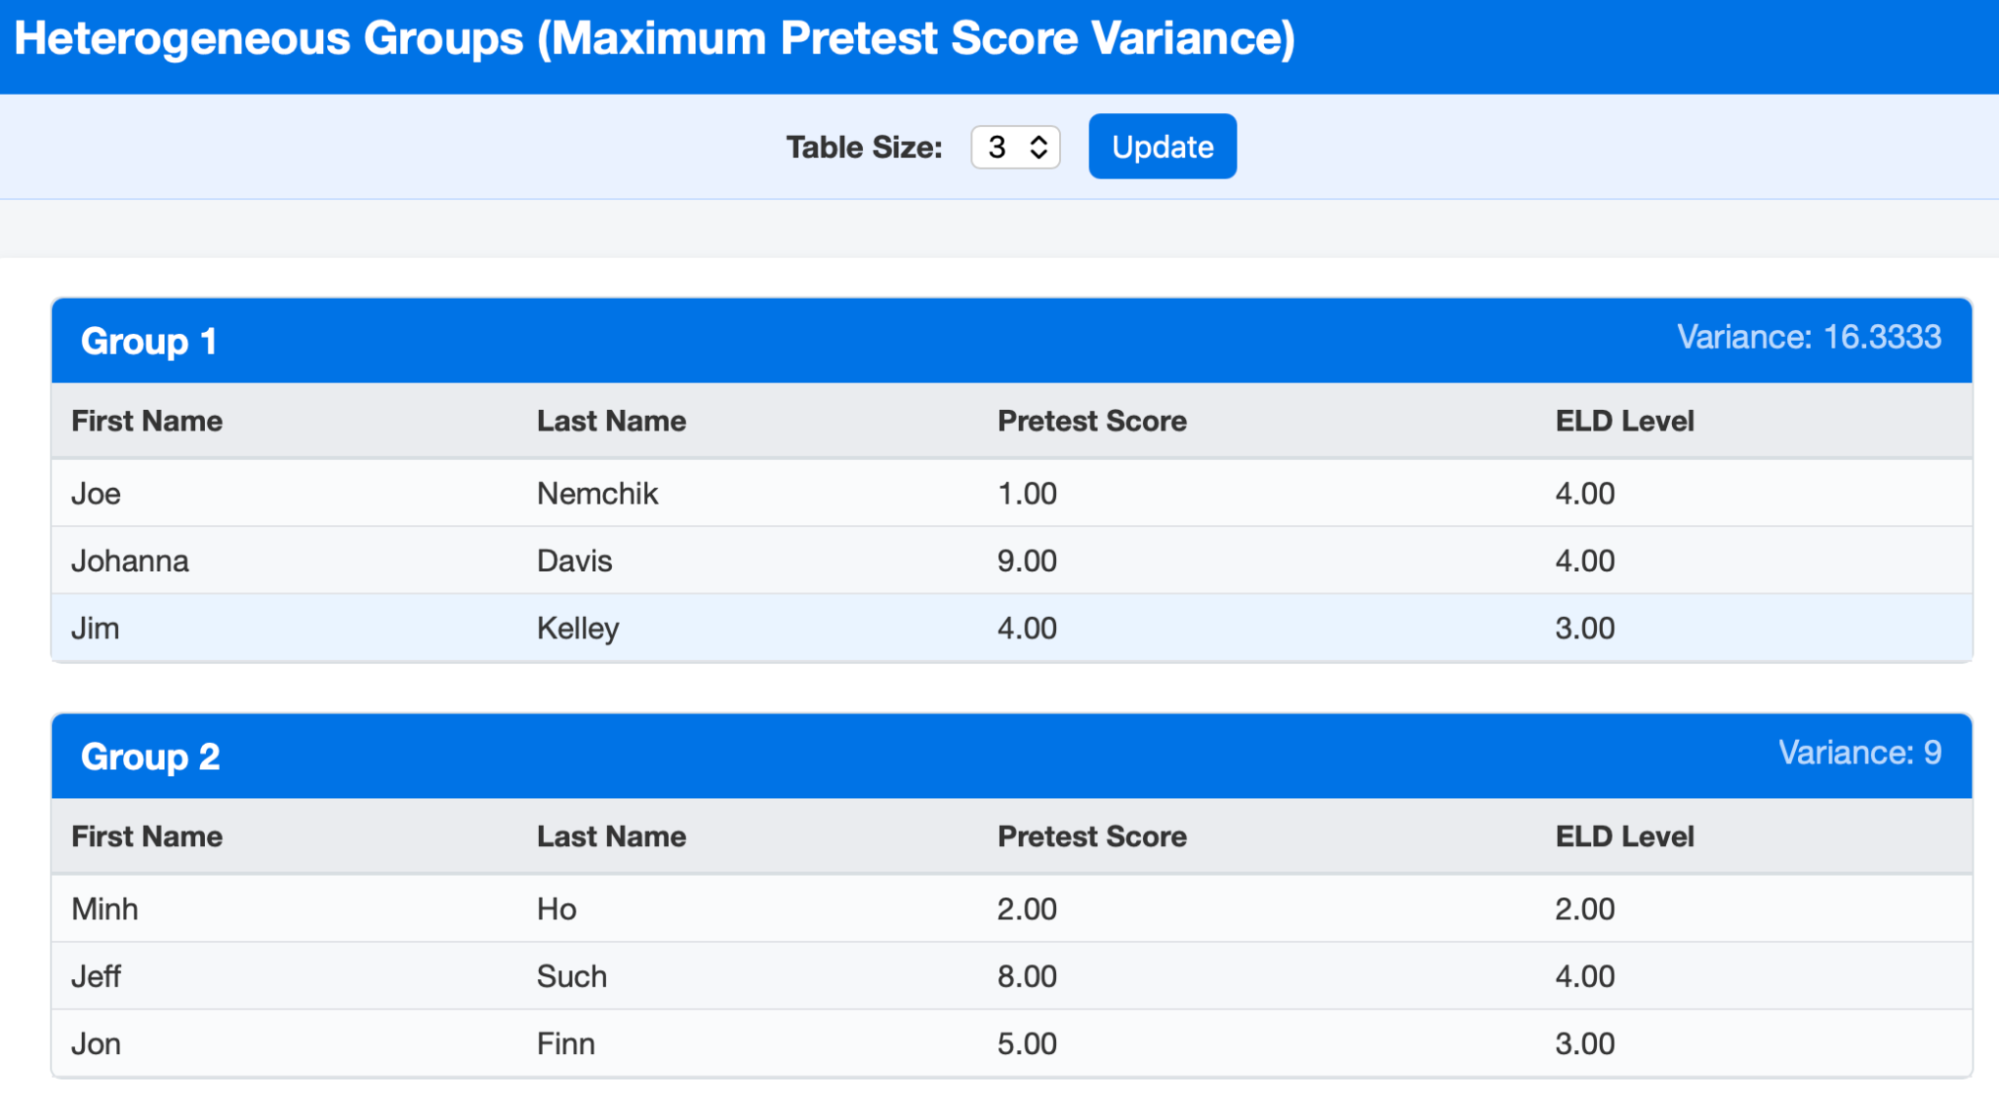
Heterogeneous Sort
This feature sorts members into groups by approximating the maximum within-group variance (Liu, 2005). That is, it makes the members of each group as different from each other as mathematically possible. This is the default setting. Given a group of test scores alone without any other information and without intention or ability to differentiate for different groups, grouping in this fashion may be more beneficial than homogenous grouping, specifically for lower performing students (Saleh et al., 2005), (Kieffer et al., 2025).
Liu (2005) suggests doing this type of sorting with a simulated annealing algorithm, but such an algorithm would overload PHP. Instead this project uses a much simpler greedy “zig-zag” algorithm to separate high and low numbers as they are grouped; the algorithm then looks for swaps to further improve variance.
Homogeneous Sort
This feature effectively creates within-classroom tracking. It groups high scoring students with other high scoring students, low scoring students with other low scoring students and groups average students with other average students. Caution should be taken with this feature. It should only be used if the teacher has a research-based plan to differentiate or remediate, especially for the lower performing groups. Research shows this type of grouping can decrease motivation and academic performance in students who are low-performance grouped (Saleh et al., 2005).
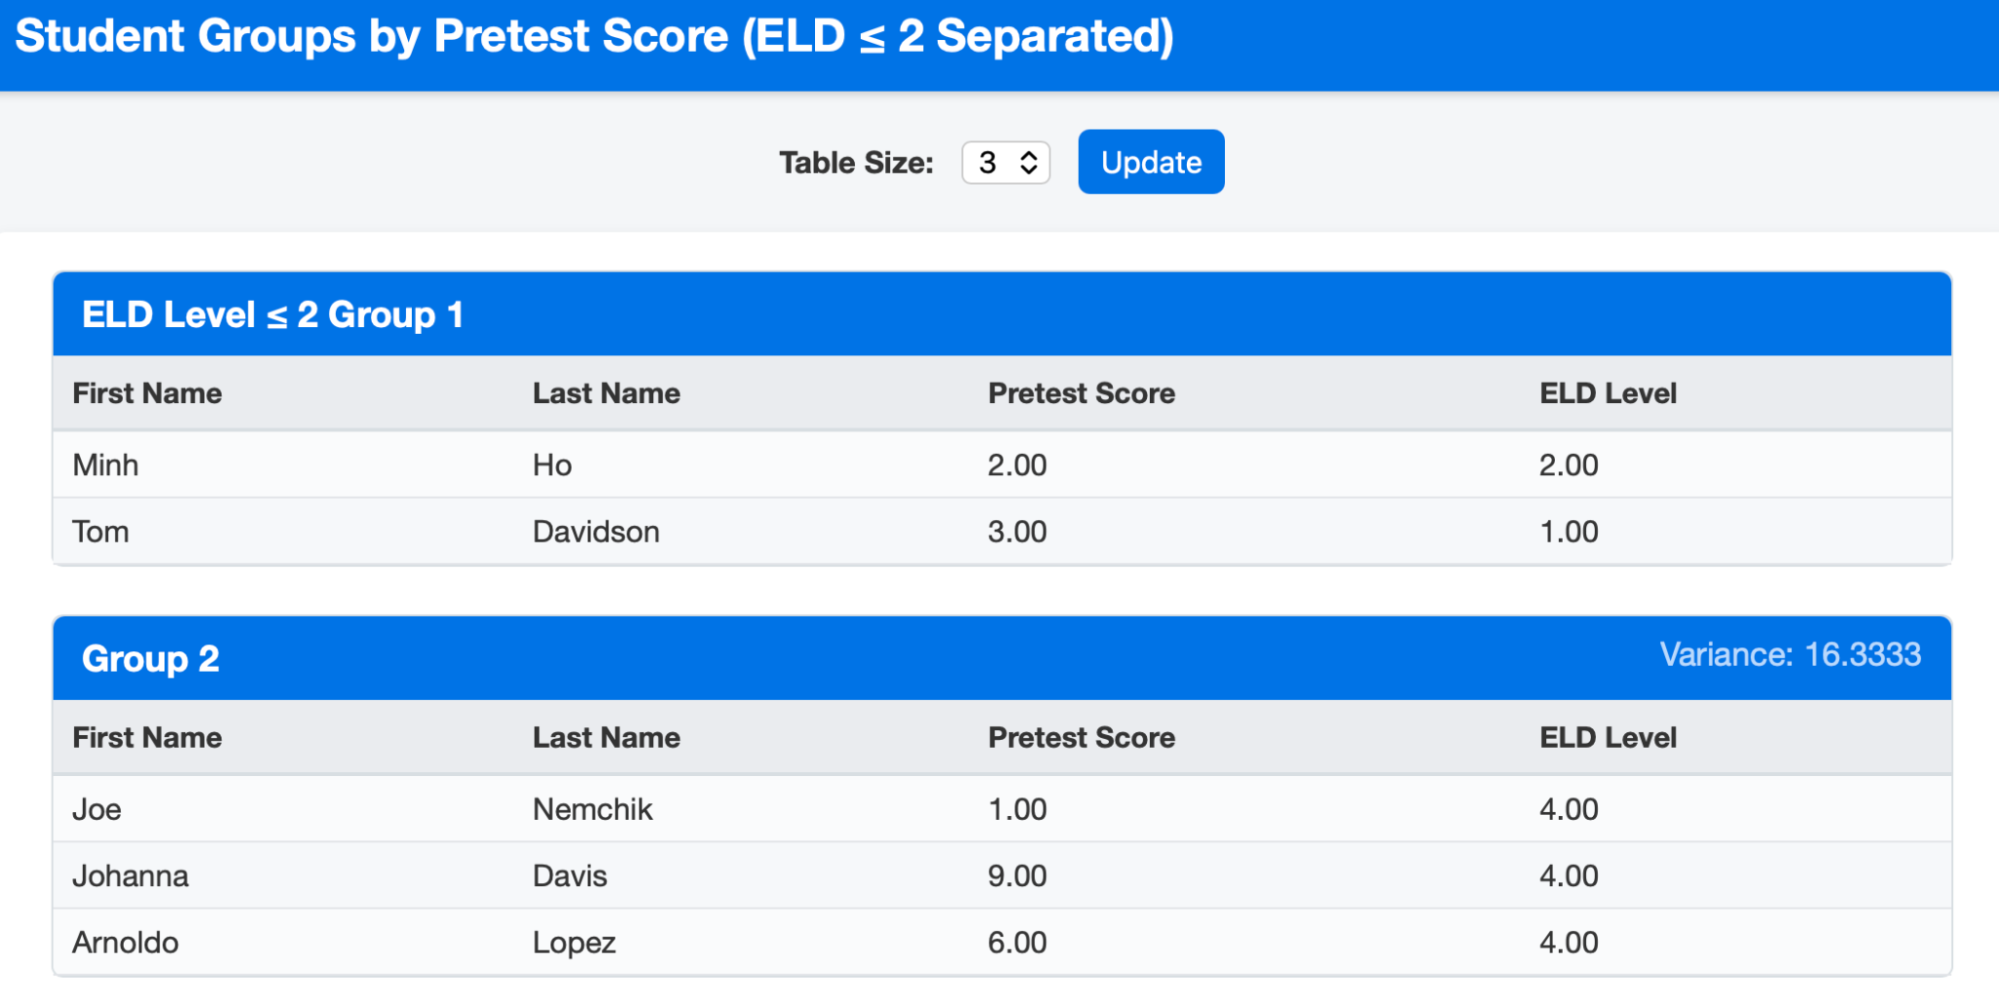
English Learner Sort
This feature sorts most students into heterogeneous groups, while independently grouping students with EL scores less than or equal to two (a stand-in for Emerging, Expanding levels). It was included based on the suggestion that lower level English Language learners may benefit from working in their own Homogeneous groups, while more advanced English Language learners may benefit from working alongside non-EL students in heterogeneous groups (Kieffer et al., 2025). Teachers might consider using this in a classroom with notably low level English Language learners, especially those who require a substantially differentiated curriculum.
First Name Sort
This feature sorts students alphabetically by first name. Given no quantitative data and limited qualitative data, teachers may find this option usable.
Random Sort
This feature shuffles students into groups with no constraint on variance. While, statistically, most of the groups this feature creates could be considered mixed-ability, there will be a tendency for it to occasionally cluster low performers together. This might be a good option for teachers who want to keep their workgroups changing but don’t have the time to consistently input new pretest data.
Conclusion
Users should start with the data entry page. Once data is entered, users can explore the different sort options, considering research and experience in choosing one. Users can then adjust table sizes to their preferences and seating availability. Finally, it is recommended that users consider additional grouping changes beyond this dashboard. This might include unique knowledge of students, such as students who do and do not work well together for personal reasons. The teacher is the expert. This dashboard is only one of many education tools.
CHAPTER FOUR
This chapter includes a link to a working beta version of the project, http://www.classroomgrouping.com. It shows several screenshot examples and describes the functionality of each.
The dashboard navigation bar has links to all six pages. The user clicks on any of the six headings on the left to navigate to each of the six different pages.
The student data entry screen allows a user to manually input student names and scores/levels. The user clicks on any of the text boxes and types. The user can also increment the numeric values using the arrows. Once data is input, the user clicks one of the “Save All Changes” buttons, either at the top or bottom of the page.
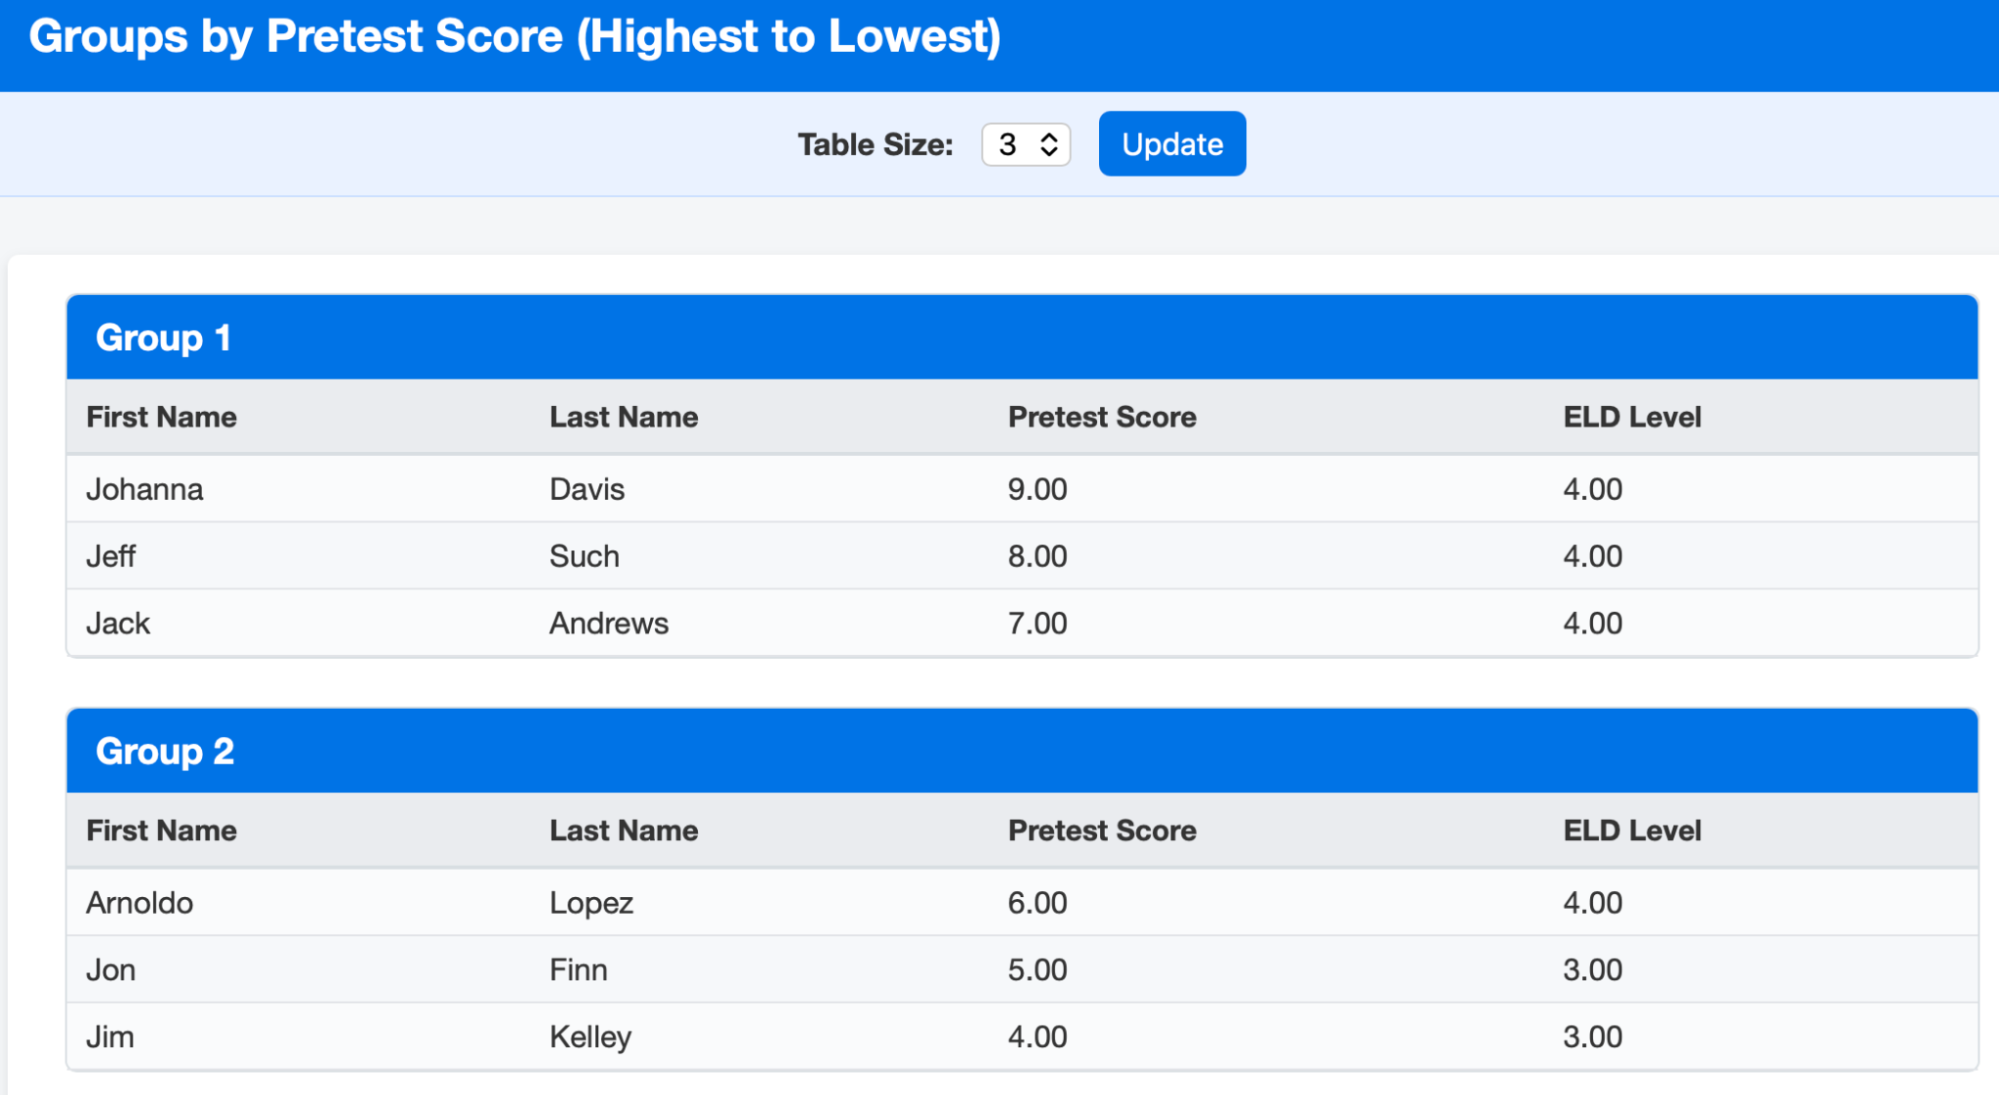
Once data is saved. The user clicks any of the other five links to see the resulting sorts. The homogeneous sort page sorts students from highest (in this example 9.00) to lowest (4.00).
The heterogeneous sort page maximizes the within group variance of the pretest scores. The variance of each group is listed only for reference. The screenshot above uses the example values from Liu (2005).
The ELD sort page works like the heterogeneous sort page, but sorts students with a low ELD level into their own group.
CHAPTER FIVE: DISCUSSION AND CONCLUSION
This project assists teachers in grouping more consistently and in line with their goals, as suggested by VanTassel-Baska et al. (2020). It allows teachers to draw grouping strategies they are already familiar with, as identified by Park and Oliver (2009). Teachers can group in less time; planning time being a major constraint identified by Schumm et al. (2000), Od-Cohen and Hadari (2015) and Ardasheva et al. (2019). The dashboard can randomize students or sort using a variety of research-based strategies. It will assist teachers in the creation of maximum variance heterogenous groups, as proposed by Liu (2005). It can also create groups based on multiple variables at once (ELD sort page). Finally, it adapts to classroom space, task constraints and class size limitations through the “table size” feature.
This dashboard helps teachers with the time constraints identified in Schumm et al., (2000) and Od-Cohen and Hadari (2015). It helps teachers and researchers sort heterogeneous groups more effectively, a identified by Liu (2005). It allows teachers to group students for differentiation without clustering low-performing students, as suggested by Saleh et al. (2005) and Kieffer et al. (2025).
Project Limitations
The literature on grouping types is not yet as robust as literature on other aspects of teaching. While the results of the included studies were statistically significant, it is hard to say conclusively if the study authors’ conclusions and speculations will hold up in all locations and all learning situations. However, the dashboard is designed to be flexible. Use of the dashboard can potentially contribute to additional research on grouping types. The teacher using the dashboard is not locked into one method for grouping or one line of research. It is a tool. It is up to the teacher to observe what is going on in their unique classroom with their unique curriculum and decide how the tool may be of greatest use.
Future Research
Future studies could implement the dashboard in choosing groups. This could include researchers using the dashboard as a way to choose their experimental groups. This could also include teachers within studies using the dashboard themselves as designed.
Classroom Teacher Study
The next step is to study the use of this dashboard with a sample of classroom teachers. Teachers could then be surveyed to determine if the dashboard is serving its intended purpose. Furthermore, qualitative feedback from teachers could potentially improve performance and usability.
Does the dashboard save time? There is no question the dashboard sorts faster and more accurately than a human would do by hand, but how does that translate to real-world planning? Teachers using the dashboard could be surveyed on its usability and perceived efficiency. Do they see it as a time saver or additional work? What would they improve?
Does the dashboard influence lesson creation? Before being given access to and information about the dashboard, teachers could answer a questionnaire regarding their current planning and grouping practices. It would be compared to a follow-up questionnaire, after being given access to the dashboard. Was there a significant change in the number of small-group lessons and the ways in which small groups were generated within lessons.
Student Outcome Study
A second step might be to try to replicate the results of Saleh et al. (2005) and Kieffer et al. (2025) using similar methodology, but using the grouping dashboard to assign heterogeneous and homogeneous groups. In the case of replicating Saleh et al. (2005) the dashboard could potentially increase the effect size of the moderating variable due to its ability to maximize variance in heterogeneous groups and maximize similarity in homogeneous groups.
Additional Grouping Study on multiple sorting factors
The multi-variable ELD sorting method has not yet to be tested on a sample of students. The current literature is full of studies that test for differences in homogeneous and heterogeneous sorting; they generally only identify moderating variables. Unique sorting strategies based on these observations will require studies of their own.
Additional Features
Version 1.0 of this dashboard is intentionally simple. It includes names and two variables. Future versions might include additional variables and additional interactions. The addition of new variables may be influenced by additional current research or future research. Variables may also be tailored to a specific school system. The variable “pre test” is purposefully vague. The researchers that influenced the “pre test” variable used a number of different instruments, all to determine and initial condition. Depending on the school, this may translate to a standardized test, a quiz from a standards-based textbook, department-created exam or an individual-created exam.
Implementation Considerations
A constant throughout the literature on instructional grouping is a call to better equip teachers with resources. That is, putting students into homogeneous groups is meaningless and even potentially harmful (Mitchell et al., 2004)(Saleh et al., 2005) unless the teacher also has the training and materials to differentiate for the various groups. In order for effective implantation, administrators must not only provide teachers with a grouping dashboard alone. They must also provide specific training on what to do once students are grouped, along with textbooks and lesson plans that lend themselves to the type of grouping desired.
Policy Implications
Instructional grouping is a powerful and controversial tool. In the hands of a properly-equipped educator it has the ability to help students thrive. In the hands of an improperly-prepared educator, it has the potential to disrupt and discourage (Kieffer et al., 2025)(Saleh et al., 2005). Any policy that is written regarding grouping should be specific and research-based. Grouping alone will not necessarily lead to better outcomes, regardless of the efficiency of the grouping tool.
Recommendations for School Districts
School districts can further streamline implantation by bulk entering student names and standardized student scores. This could potentially save hundreds of teacher hours. Teachers would receive login information and be ready to sort with just a few clicks, rather than face the arduous task of inputting names one at a time. Potentially, this could also encourage a greater number of teachers to implement. Teachers would not have to weigh the up-front cost of typing or copying every student from their roster.
Alternatively, some districts may have a way for individual teachers to access their student data in the form of a spreadsheet, word document or .csv file. A version of the dashboard could be tailored to allow data from such files to populate the dashboard's MySQL database with several clicks. This would be less preferable to a bulk district action, but may be more practical, depending on how the district stores its data.
Recommendations for Individual School Sites
School sites should implement the dashboard with trainings on the suggested uses of the different sorting algorithms. Specifically, teachers should be cautioned against grouping lower performing students together (Mitchell et al., 2004)(Saleh et al., 2005). When it comes to small groups, what not to do may be just as important as what to do. Schools should also consider providing specific lesson templates for differentiated small-group instruction. Without this, there may be zero net benefit to one specific grouping strategy over another.
Recommendations for Individual Teachers
This project does provide a “set-it-and-forget-it” option. Though it is not meant to be an end all, be all option. Throughout the literature reviewed, a constant trend is teacher and student judgment in group selection (Mitchell et al., 2004). Liu (2005) saw his heterogeneous algorithm suggestion as a baseline for research. It was not meant to create the ideal set of groups. It is in this spirit that it is suggested that teachers use it as a baseline of their own, starting out with heterogeneous groups and then using the judgment that comes from getting to know this year’s class as well as years of teaching experience. This is to say, if a teacher uses the dashboard but feels several students are misgrouped or out of place, this is not necessarily a sign the dashboard is not working. The dashboard is foremost meant to be a timesaver and a guide. It is likely that both research and technology are a long way away from being able to assign truly optimal groups 100% of the time.
References
Amato, C. H., & Amato, L. H. (2005). Enhancing Student Team Effectiveness: Application of Meyer-Briggs Personality Assessment in Business Courses. Journal of Marketing Education, 41–51.
Ardasheva, Y., Newcomer, S. N., Ernst-Slavit, G., Morrison, S. J., Morrison, J. A., Carbonneau, K. J., & Lightner, L. K. (2019). Decision-making practices of experienced upper elementary teachers during small group instruction to support English learners. The Elementary School Journal, 120(1), 88–108. https://doi.org/10.1086/704392
Bonesrønning, H., Finseraas, H., Hardoy, I., Vaag Iversen, J. M., Nyhus, O. H., Opheim, V., Salvanes, K. V., Sandsør, A. M., & Schone, P. (2021). Small group instruction to improve student performance in mathematics in early grades: Results from a randomized field experiment. SSRN Electronic Journal. https://doi.org/10.2139/ssrn.3979348
California Department of Education. (2012, November). California english language development standards (electronic edition). https://www.cde.ca.gov/sp/ml/documents/eldstndspublication14.pdf
ISBN 978-0-8011-1738-1
Dahl-Leonard, K., Hall, C., Mesa, M. P., Zucker, T. A., & Peacott, D. (2024). Exploring small-group reading instruction for students at risk for reading difficulties in kindergarten classrooms. Reading & Writing Quarterly, 40(6), 549–566. https://doi.org/10.1080/10573569.2023.2298497
Dussling, T. (2020). English Language Learners’ and Native English-Speakers’ Spelling Growth after Supplemental Early Reading Instruction. International Journal of Education & Literacy Studies, 8(1), 1–7.
Dussling, T. M. (2020). The Impact of an Early Reading Intervention with English Language Learners and Native-English- Speaking Children. Reading Psychology, 41(4), 241–263.
Johnson, D. W., & Johnson, F. P. (1991). Joining togetherL Group theory and group skills. Prentice-Hall.
Kamps, D., Abbott, M., Greenwood, C., Wills, H., Veerkamp, M., & Kaufman, J. (2008). Effects of small-group reading instruction and curriculum differences for students most at risk in Kindergarten. Journal of Learning Disabilities, 41(2), 101–114. https://doi.org/10.1177/0022219407313412
Kieffer, M. J., Proctor, C. P., Weaver, A. W., Karbachinskiy, S., Chen, Q., Yu, Q., Solano, G., Coleman, A., Cavanaugh, S. M., Wu, X., Cappella, E., & Silverman, R. D. (2025). Effects of heterogeneous versus homogeneous grouping of English learners’ language and literacy development: Evidence from a randomized controlled trial. American Educational Research Journal, 62(5), 909–945. https://doi.org/10.3102/00028312251355989
Liu, E. Z.-F. (2005). To propose an algorithm for team forming: Simulated annealing K team-forming algorithm for heterogeneous grouping. International Journal of Instructional Media, 32(2), 195–197.
McManus, S. M., & Gettinger, M. (1996). Teacher and student evaluations of cooperative learning and observed interactive behaviors. Journal of Educational Research, 90, 13–22.
Mesa, M. P., Hernandez, J. A., Phillips, B. M., & Lonigan, C. J. (2025). Peer effects in small-group language instruction. Early Childhood Research Quarterly, 73, 205–214. https://doi.org/10.1016/j.ecresq.2025.07.007
Mitchell, S. N., Reilly, R., Bramwell, F. G., Solnosky, A., & Lilly, F. (2004). Friendship and Choosing Groupmates: Preferences for Teacher-Selected vs. Student-Selected Groupings in High School Science Classes. Journal of Instructional Psychology, 31(1), 20–32.
Moody, S. W., Vaughn, S., & Schumm, J. S. (1997). Instructional Grouping for Reading. Remedial and Special Education, 18(6), 347–355.
Od-Cohen, Y., & Hadari, J. (2015). Implementing Small Group Instruction among novice teachers in their first year of teaching. Procedia - Social and Behavioral Sciences, 209, 549–557. https://doi.org/10.1016/j.sbspro.2015.11.286
Park, S., & Oliver, J. S. (2009). The Translation of Teachers’ Understanding of Gifted Students Into Instructional Strategies for Teaching Science. Journal of Science Teacher Education, 20(4), 333–351.
Saleh, M., Lazonder, A. W., & Jong, T. D. (2005). Effects of within-class ability grouping on social interaction, achievement, and motivation. Instructional Science, 33(2), 105–119.
Schullery, N. M., & Schullery, S. E. (2006). Are Heterogenous or Homogenous Groups More Beneficial to Students. Journal of Management Education, 30(4), 542–556.
Schumm, J. S., Moody, S. W., & Vaughn, S. (2000). Grouping for Reading Instruction: Does One Size Fit All? Journal of Learning Disabilities, 33(5), 477–488.
Tieso, C. (2005). The Effects of Grouping Practices and Curricular Adjustments on Achievement. Journal for the Education of the Gified, 29(1), 60–89.
ii
[1] In this study “g” (Keiffer et al., 2025, p. 929) refers to “hedges’ g” (effect size).